Building Docker images is an important component of the software delivery pipeline for modern applications. It’s how we package our apps and services so that they can be distributed to others and deployed to production. While the Dockerfile has long been the standard for defining container images, it is known to be challenging to make changes and debug when issues arise. It’s currently a real pain to understand the build time state during the different stages of the build. What was the state of the ARG? Which files were copied into the image?
Recently, we have been making updates to the Docker Build clients (Buildx) and our VS Code extension (Docker DX) to improve the developer experience when using Docker. Today, we are sharing the next stage of that process with the introduction of Build Debugging in VS Code and Docker Build.
With the new debugging feature in Buildx from Docker, you will be able to reduce the time you spend fixing your Docker builds. In this post, you’ll learn how to configure the Buildx debugger in Visual Studio Code, step through a build and inspect variables and the image’s file system, and open a shell inside the image being built. Finally, you will learn a little about the debugger’s implementation and how it can be integrated into other editors.
Configuring Visual Studio Code
To start debugging Dockerfiles in Visual Studio Code:
- Install the latest version of the Docker DX extension.
- Update to the latest version of Docker Desktop to ensure you have the latest Docker build tooling.
- Run
docker buildx versionand verify that your Buildx is at least version 0.29.x.
Creating a Launch Configuration
Open up your Dockerfile and open the Run and Debug view in Visual Studio Code. If you do not have any launch configurations, you will see something like the following.
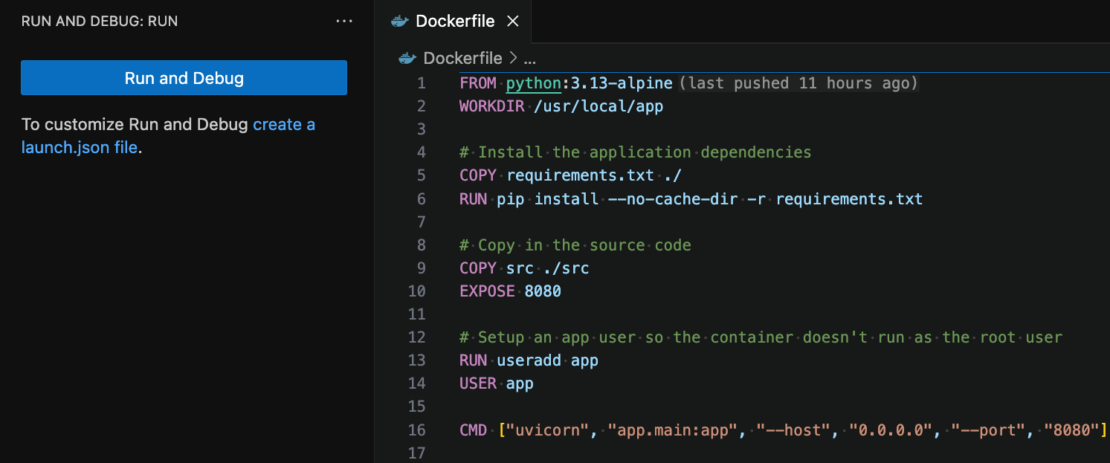
Figure 1: Run and Debug view opened in Visual Studio Code with no launch configurations defined.
Click on the “create a launch.json file” hyperlink. If you have launch configurations, open up your launch.json file by clicking on the cog icon in the top right hand corner of the Run and Debug view.
In your launch.json file, create a new launch configuration for debugging your Docker build. You can use the sample below to get started. For a full description of the various attributes in a launch configuration, see here.
{
    // Use IntelliSense to learn about possible attributes.
    // Hover to view descriptions of existing attributes.
    // For more information, visit: https://go.microsoft.com/fwlink/?linkid=830387
    "version": "0.2.0",
    "configurations": [
        {
            "type": "dockerfile",
            "request": "launch",
            "name": "Docker: Build",
            "dockerfile": "Dockerfile",
            "contextPath": "${workspaceFolder}"
        }
    ]
}
Adding a Breakpoint
Now that you have completed setting up your launch configuration, let’s add a breakpoint to our Dockerfile. Place a breakpoint next to one of your RUN instructions by clicking in the editor’s left margin or by pressing F9. A circle should appear to indicate that a breakpoint has been added.
Launching the Debugger
We are now ready to start the debugger. Select the launch configuration you created and then hit F5. The build should pause at the RUN line where you placed the breakpoint.
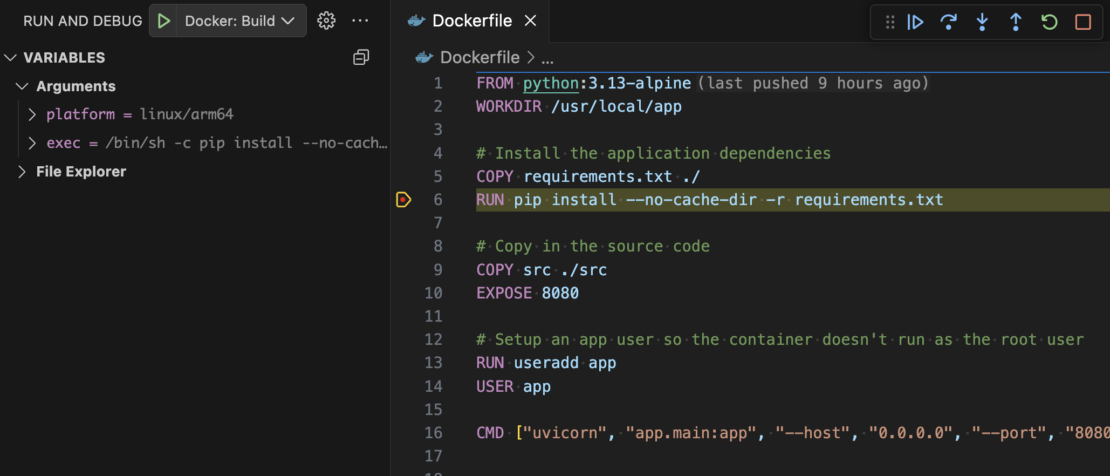
Figure 2: Docker build suspended by a breakpoint in Visual Studio Code.
Debugging Features
We will now walk you through the three different features that the Buildx Debugger provides.
Inspecting Variables
When a build is in a suspended state, you can look at any variables that may have been defined. In this example, by looking at the executed command’s workdir value on the left-hand side, we can now see that the command is not being run in the right folder as we had copied the contents into /app. We can fix this by adding WORKDIR /app before the RUN line. Also note that we can view variables that have been defined by our image and the base image as seen by VAR and NODE_VERSION.
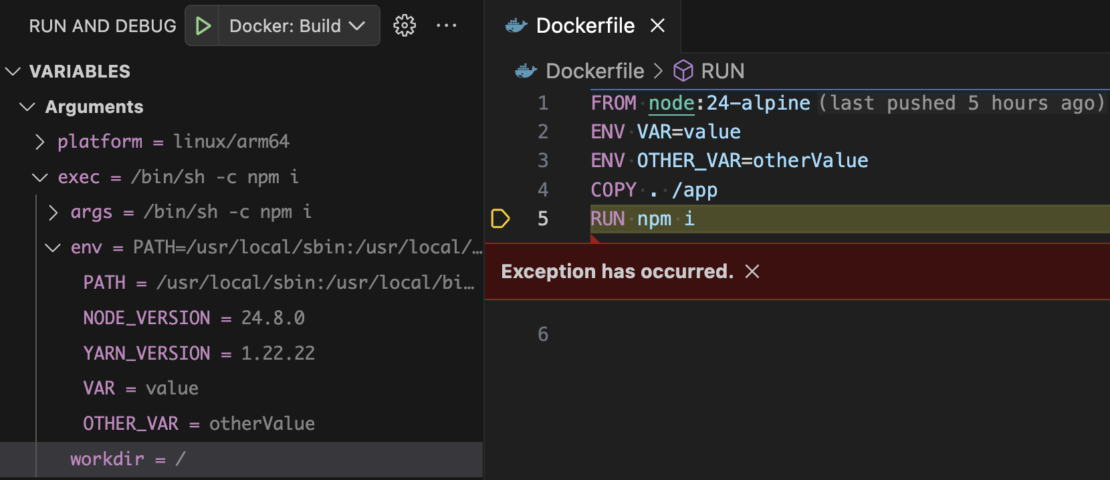
Figure 3: Docker build encounters an error and is suspended by the debugger instead of terminating.
File Explorer
In addition to inspecting variables, you can also look at the structure of the file system to see what is already there and what you have copied in. For text files, you can also see its file content as shown in the file’s data field.
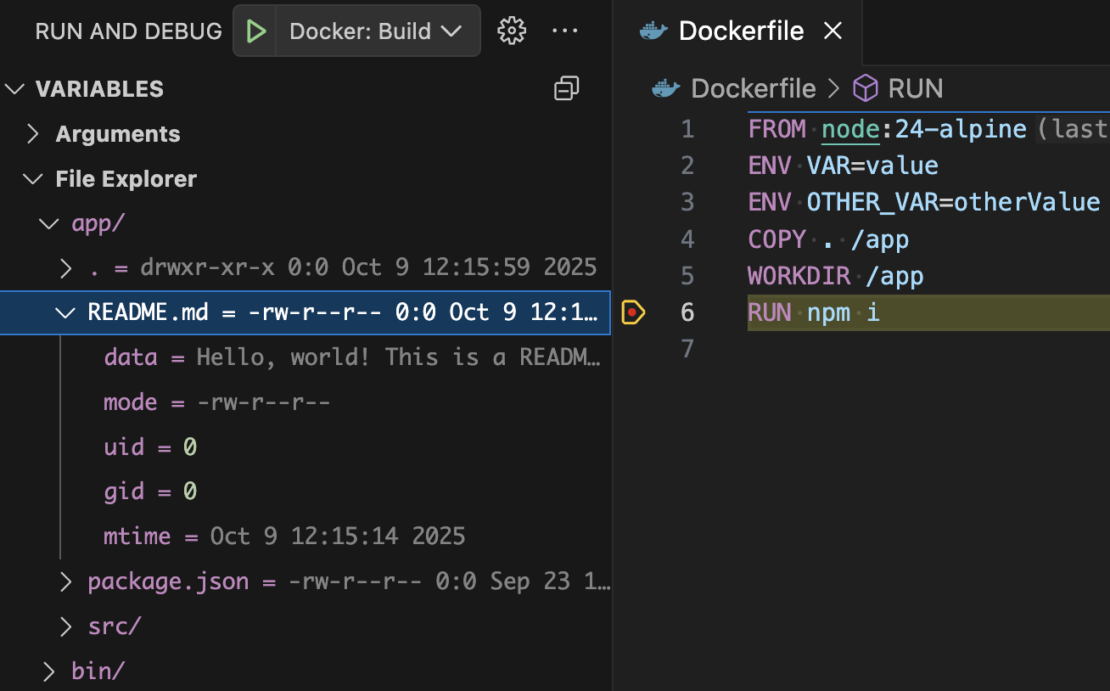
Figure 4: View the file system of the Docker image being built.
Interactive Debugging
Creating the right Dockerfile is often an iterative process. Part of this is usually because the host system you are developing on shares few similarities with the image you are building. Consider the differences between running Ubuntu locally but trying to build an Alpine Linux image. The small differences in package names creates a lot of back and forth between your editor and your browser as you search for the right name. You add a line here and then maybe comment another line somewhere else before running docker build again to just hope for the best.
This iterative process can now be streamlined with the help of the debugger. When your build is in a suspended state, open the Debug Console view and then place your cursor in the input field at the bottom. Type in exec and then hit the enter key. The Terminal view should now open with a shell that is attached to the image that is being built.
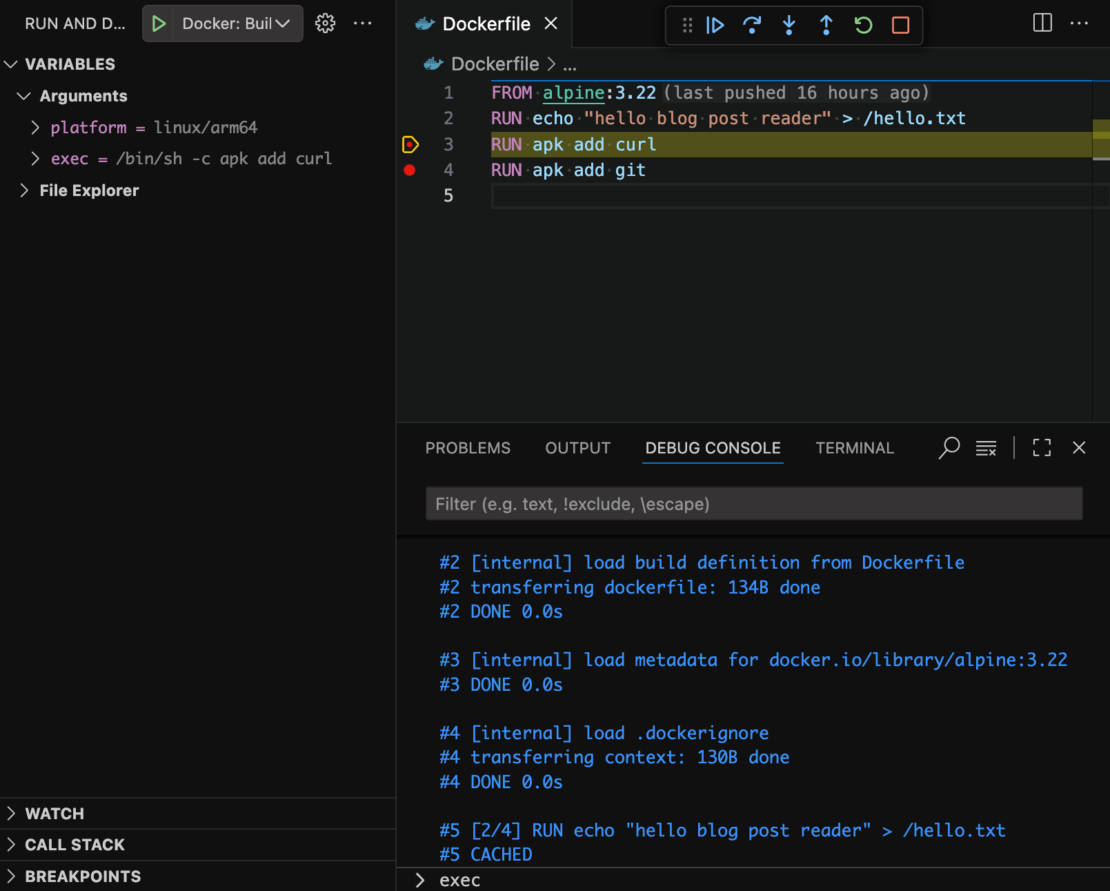
Figure 5: Use the Debug Console to open a shell into the Docker image being built by running exec.
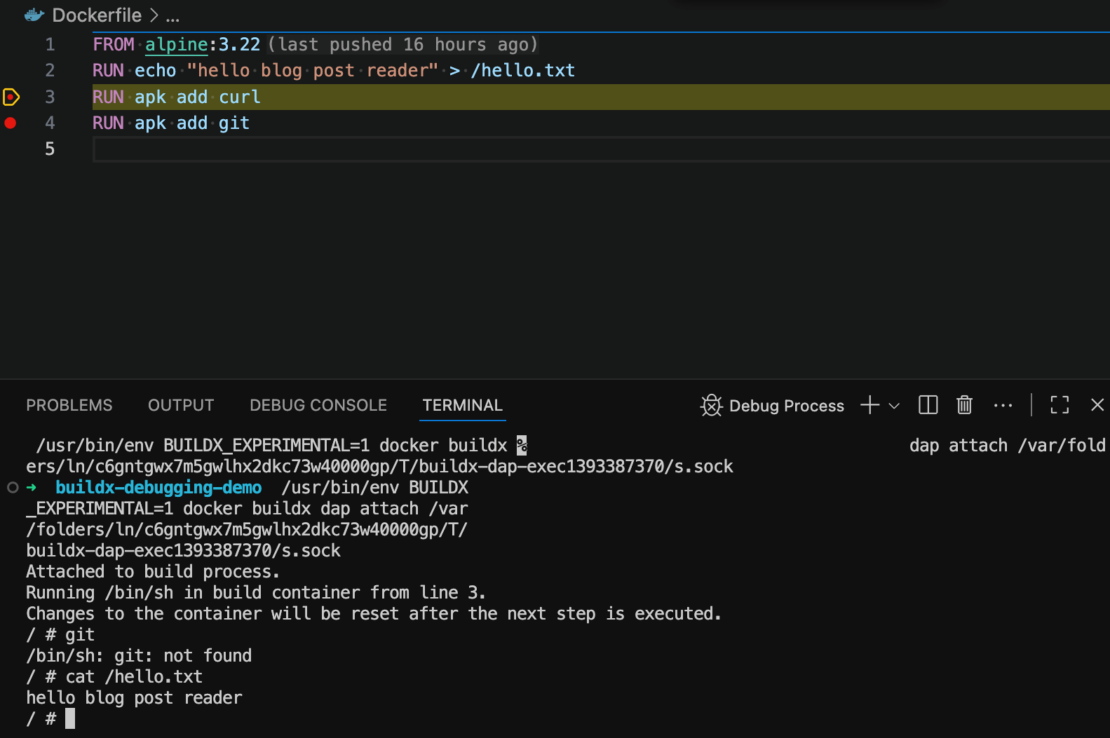
Figure 6: The Docker image that is being built can now be accessed and inspected with a terminal.
This feature is a game changer as you can now easily open the image of a Dockerfile at any given step and inspect its content and run commands for testing. Previously, we would have to comment everything after the buggy line, build the Docker image, and then manually run and open a shell into the image. All of that is now condensed into adding a breakpoint in your editor and starting a debug session!
Keep in mind that none of the changes you make in the terminal are persisted so this is purely for experimentation. In the figure below, we can see that a file was created when the debugger was paused at line 3. When the debugger was advanced to line 4, the file disappeared.
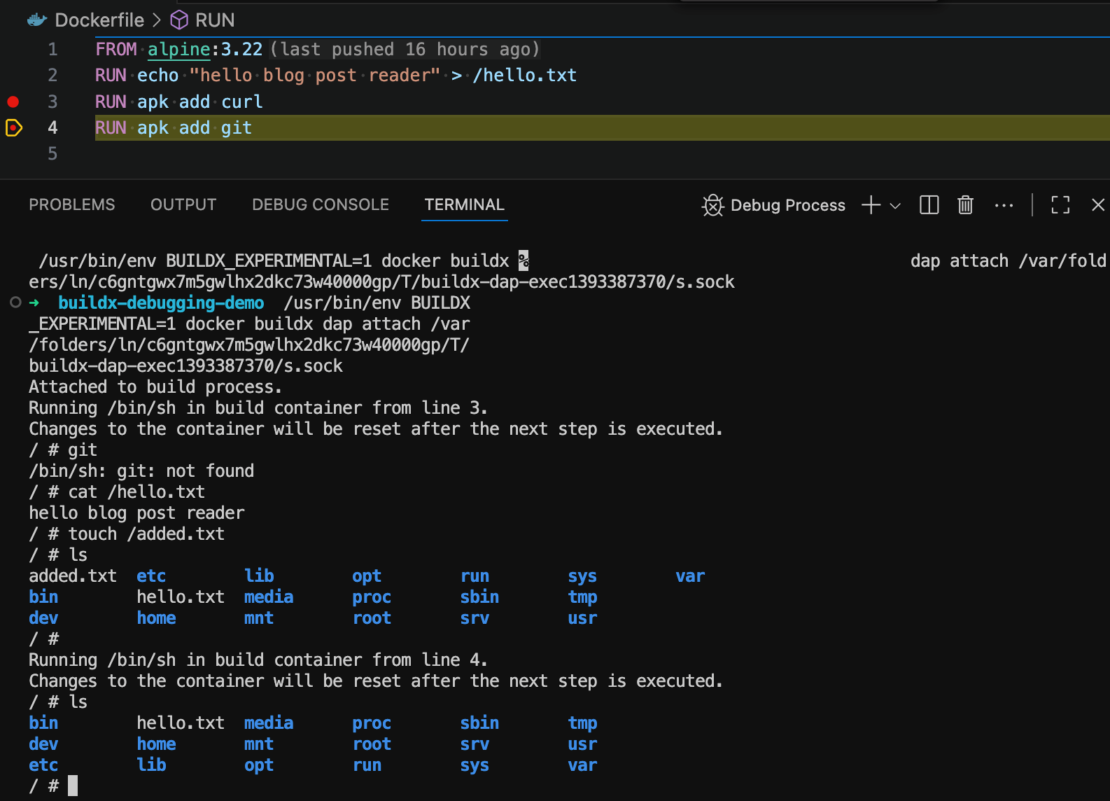
Figure 7: Changes to the Docker image inside the exec terminal will be reset when the debugger steps to another line.
Integrations powered by an Open Specification
Just like our work with the Docker Language Server that implements the Language Server Protocol, the Buildx debugger is built on open standards as it implements the Debug Adapter Protocol which means that you can debug Dockerfile builds with any editor that supports the protocol. Besides Visual Studio Code, we also provide an official plugin for Neovim. For the JetBrains users out there, we have verified that it integrates well with the LSP4IJ plugin. If your favourite editor supports the Debug Adapter Protocol, there should be a way for the Buildx debugger to integrate with it.
Thank You
We want to take this opportunity to thank Kohei Tokunaga (ktock) for his ideas and initial work around this feature. The contributions he provided to Buildx gave us a great foundation for us to build out and complete this feature. This release would not have been possible without his help. Thank you, Kohei!
Next Steps
- Download the Docker DX extension and try out the new debugging feature.
- Share feedback and issues with us in our GitHub repositories for Docker DX and Buildx.
- You can also submit feedback through the Docker feedback page.
Learn More
- Setup the Buildx debugger in Neovim with nvim-dap-docker.
- Setup the Buildx debugger in a JetBrains editor with the LSP4IJ plugin.
- Read the Buildx documentation about our implementation of DAP and configuring launches.


