Docker Verified Publisher Program
Reach developers and grow your brand with Docker
If you’re publicly distributing your software via Docker Hub, the Docker Verified Publisher program is for you. Docker Hub is the world’s largest container registry, with more than 15 million active developers and 13 billion image pulls per month. As a Docker Verified Publisher, you will differentiate yourself from the rest while you communicate trust and security to your customers. You’ll benefit from improved awareness, discoverability, data insights, and co-marketing opportunities.
Contact us today to learn more
Thank you for your interest. The Docker Team will be in touch.
Trust, Reporting, Security, Discoverability, and More
The Docker Verified Publisher (DVP) program provides organizations that publicly distribute their software via Docker Hub improved trust, enhanced software discoverability, metrics, and an avenue to better reach their global developer audience.

Communicate Trust and Differentiate Your Brand
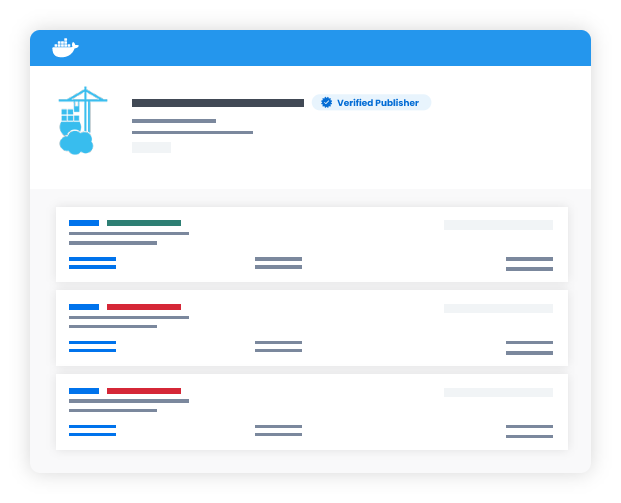
Docker Verified Publisher badging on your Docker repos and namespace shows customers that you’re the trusted source for your software. Priority search results and automatic security scanning enhance your customer experience.
Better Customer Experience
Distribute your software to developers via Docker Hub free of any rate limiting (your developers can pull as many images as they want, whenever they want).
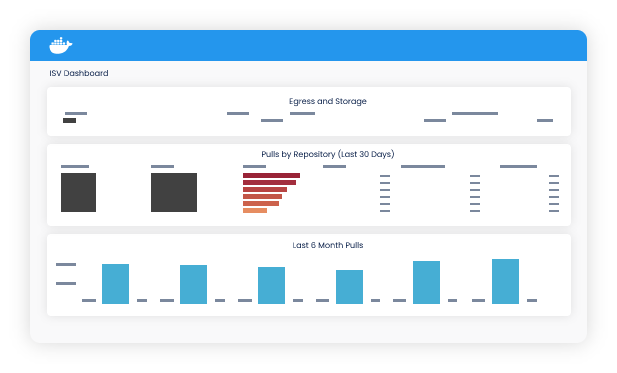
Gain Market Insights
Docker provides regular reporting that includes aggregated data across all of your namespaces and by repository. You can track trends, gauge repo popularity, and spot opportunities.
Be a Trusted Source for Docker Business Customers
With a Docker Business subscription, use the Image Access Management feature to limit developers’ access to only trusted Docker sources – including Docker Official Images and Docker Verified Publisher Images.
Unlock Co-Marketing Opportunities
Verified Publishers have access to joint marketing activities with Docker like blogs, webinars, and exclusive DockerCon sponsorships.
Key Features
Verified Publishers benefit from an enhanced Docker experience. Based on tier*, you get:
“Verified Publisher” badge signaling you are a trusted and authentic source
Improved discoverability in Docker Hub search results
Removal of rate limiting for developers
Automatic and manual security scanning tools
Reporting for actionable market insights
Co-marketing opportunities including access to DockerCon sponsorship
*Contact us for detailed pricing and feature information
What our Partners Say
“With cloud-native applications being deployed into production across industries, we see development teams increasingly looking for container content that is based on trusted, reliable and verified code. […] we’re pleased to be able to bring UBI to Docker Hub users as part of the Docker Verified Publisher program.”

Mithun Dhar
Vice President and General Manager
“VMware is pleased to join the Docker Verified Publisher program. This provides developers unrestricted access to our artifacts, and allows them to safely adopt the popular open-source technologies we’ve made available.”
Ashok Aletty
Vice President of Engineering
Selected Partners
Here are a few selected Docker Verified Publisher partners:


